Soundcharts: analytics for artists
Soundcharts is a data analysis tool.
Streaming stats, radio airplay analytics, chart positions, social media metrics — all of this is scattered across different platforms, and collecting it manually is a real mess. Until recently, I struggled with that too, but there is a resource that makes this process not only efficient but truly comfortable.
Soundcharts — a platform that makes sure all your data is in one place. Here you can track streaming trends, analyze social reach, and see where your tracks are played most often.
In this article, I explain in detail how to use Soundcharts effectively to grow a music project. Make data analysis part of your comfortable business!
Dashboard (Overview)
Imagine logging into your account and, within seconds, seeing the full picture of what is happening with your music right now. That is exactly what Overview in Soundcharts is for. It is your home page, providing a quick overview of key metrics — from plays and followers to chart positions.
What is it for?
This is your daily report, allowing you to quickly assess the overall state of the project. Instead of opening a dozen tabs — Spotify for Artists, YouTube Analytics, Instagram, Apple Music — you see everything in one place. This saves time and helps you react to changes immediately.
What do we analyze?
Growth dynamics: Pay attention to graphs showing gains or declines in followers and plays.
Reaction to releases: Released a new track? See how the metrics change in the first few days.
Platform comparison: Are you more popular on Spotify or Apple Music? And where is your audience growing faster?
Practical case:
Imagine you have just launched a PR campaign for a new single. You open the Dashboard and see a sharp spike in Spotify plays. At the same time, the number of followers on Instagram remains steady. This may indicate that the PR worked for streaming, but not quite for social media. Based on this, you can adjust your strategy and, for example, launch targeted Instagram ads to attract new followers.
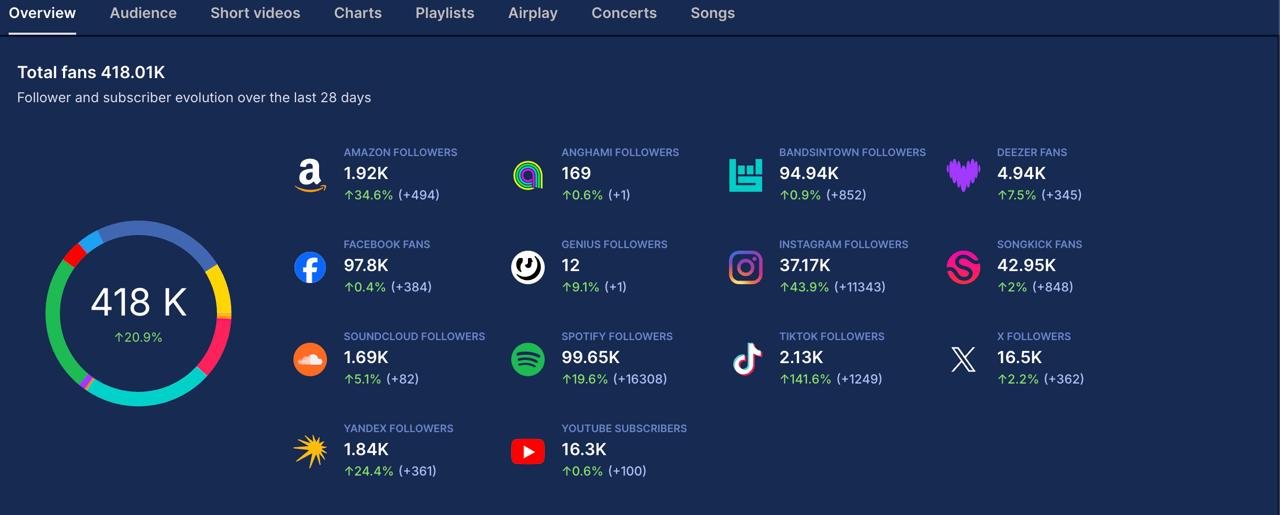
Chart tracking (Charts)
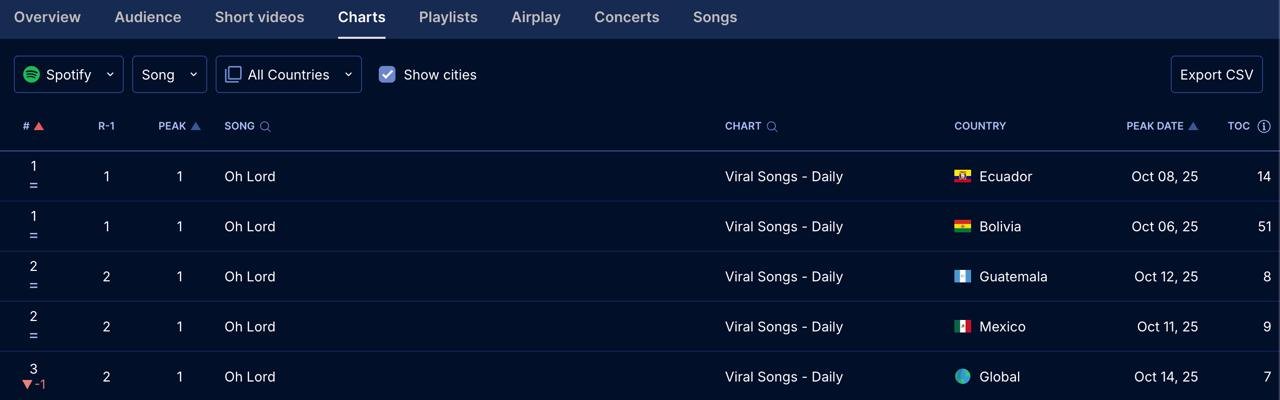
After quickly assessing the overall picture on the Dashboard, it is time to dive into the details. The Charts section in Soundcharts is your personal encyclopedia of chart success. It shows how your tracks and albums move up or down in different rankings around the world.
What is it for?
This section helps you understand how effectively your music reaches listeners. Instead of manually checking every chart, Soundcharts aggregates data from different platforms — from Spotify and Apple Music to Shazam and radio stations. This helps you not only see the current position, but also track its dynamics.
What do we analyze?
Geography of popularity: Look at which countries your songs most often enter the charts in. Maybe your track unexpectedly became a hit in Japan or Brazil.
Playlist presence: Did your track get added to the "New Releases" playlist? How did that affect its chart position?
Pitching effectiveness: If you sent your music to radio stations, you can check here whether airplay appeared and how it affects positions in radio charts.
Practical case:
Imagine you released a new single and submitted it for consideration to several Apple Music editorial playlists. A week later you open Soundcharts and see that your track reached No. 20 on the Apple Music chart in Ukraine, and also entered the top 100 in Poland. At the same time, you notice that your single appeared on the "New Music Daily" playlist in both countries. This is clear proof that the pitch was successful, and you can use this data for further promotion, for example by launching targeted ads specifically to the Polish audience.
Chart tracking gives you a clear understanding of where your music is succeeding and helps you make informed decisions for further growth.
Audience
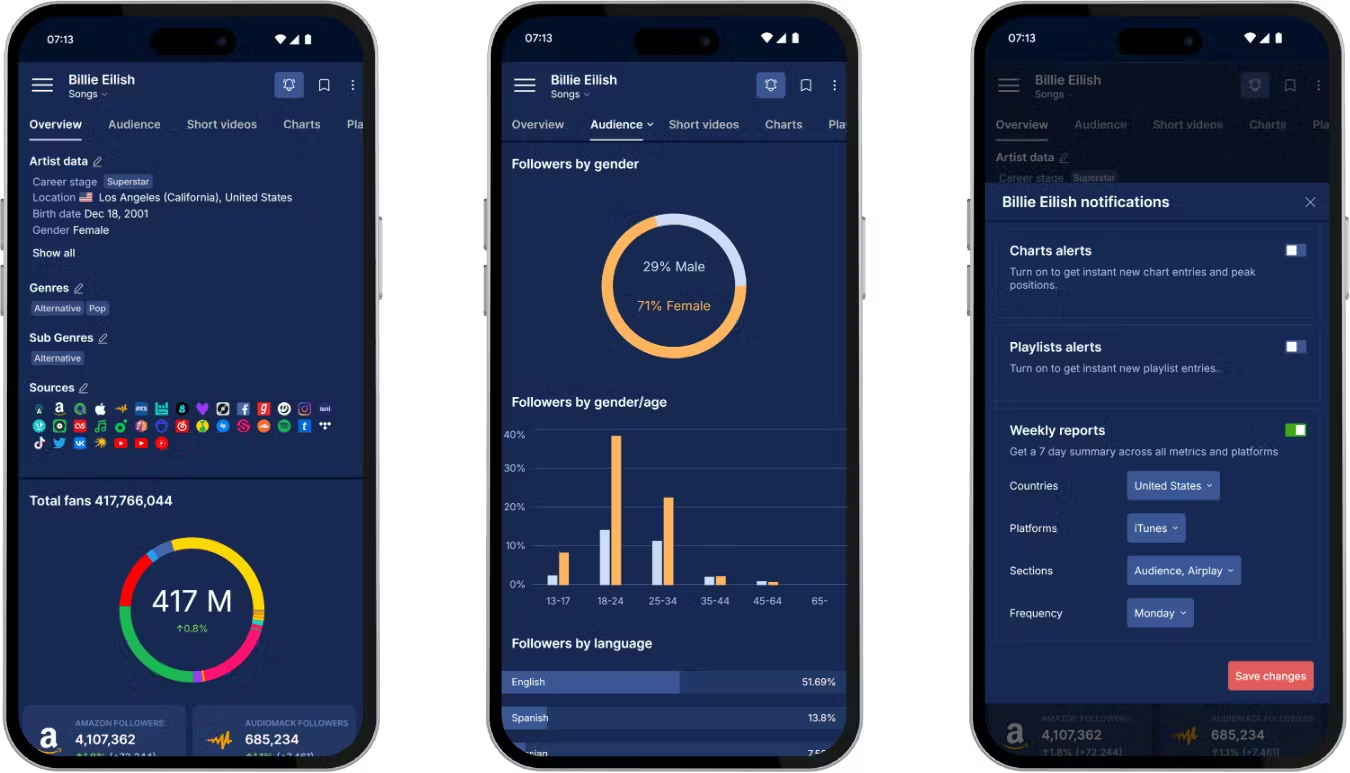
Now that we know where our songs stand in the charts, it is time to dive into the heart of the music business — the audience. The Audience section in Soundcharts gives you a detailed analysis of plays on the main platforms: Spotify, Apple Music, Deezer, and others.
What is it for?
This analytics lets you understand exactly how your music is spreading. You can see which songs from your catalog are the most popular, which countries listen to them the most, and which playlists generate the most traffic.
What do we analyze?
Song breakdown: See which tracks from your album stand out. Maybe the song you thought was not the strongest is actually a hit with listeners.
Listening geography: This is one of the most important metrics. Soundcharts will show you which cities and countries listen to your songs most often. This is ideal information for planning future tours or targeted ads.
Playlist analysis: You will see which playlists your tracks were added to, and how many plays they generated from there. This helps evaluate the effectiveness of a PR manager’s work or understand which tracks interest editors.
Practical case:
Imagine you notice that a track released a year ago suddenly saw a rise in plays in Berlin. You go into Soundcharts and see that it was added to the German playlist "Alternative Fresh". This may be a sign that you should focus on promo in Germany to build on the success.
Social media — the pulse of the audience
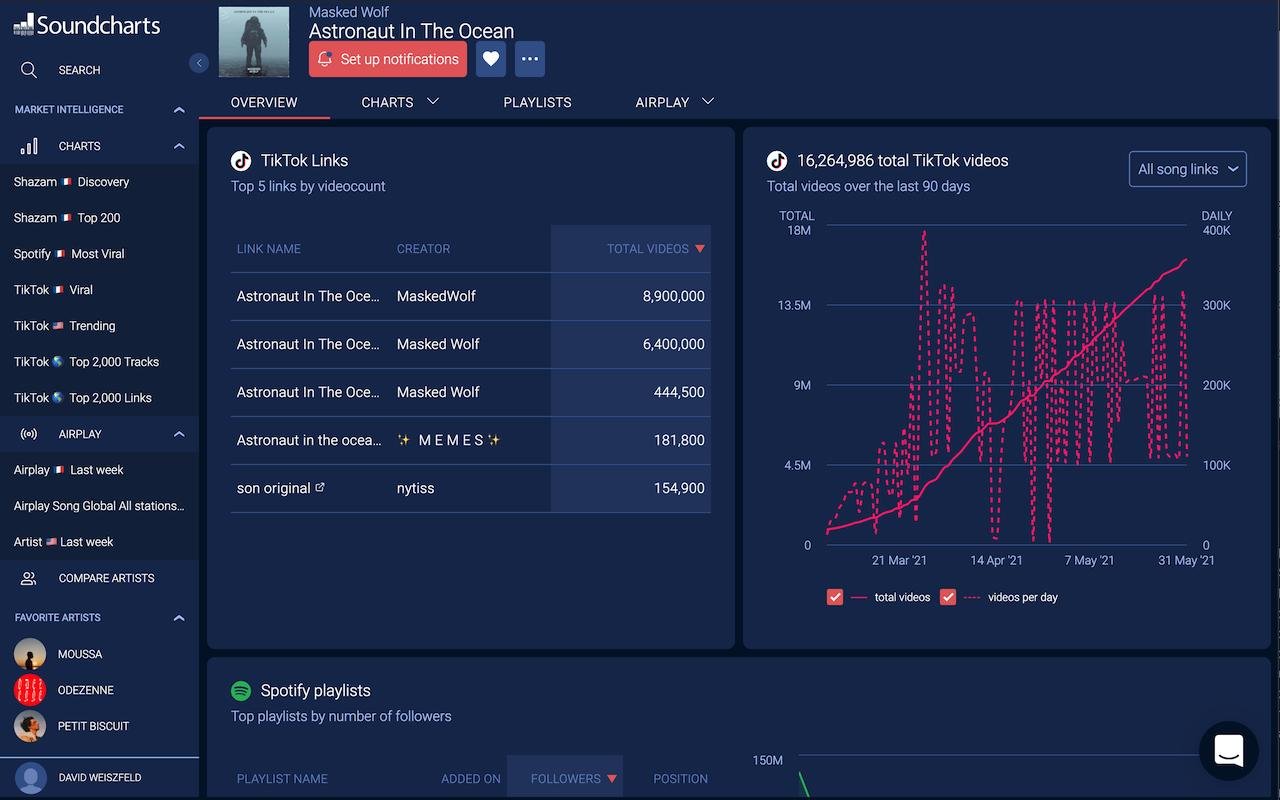
Soundcharts has tabs in the Audience section that show detailed social media stats for an artist. However, they are available with a paid subscription. Still, this data will help you turn chaotic likes and comments into clear insights. You will be able to track follower growth and audience engagement on key platforms such as Instagram, YouTube, TikTok, and more.
What is it for?
This tool gives you a clear understanding of how your social media presence affects your music career growth. Instead of switching between different analytics dashboards, you see everything in one place, which allows you to quickly assess content performance.
What do we analyze?
Follower growth: Watch how your follower count changes over time. This can indicate the success of a particular post or ad campaign.
Engagement: Track the number of likes, comments, reposts, and views. This will help you understand which content resonates most with your audience.
Platform comparison: It may be that your content that performs well on Instagram is not as successful on YouTube, and vice versa. This will give you an idea of how to adapt your strategy for each platform.
Practical case:
Imagine you posted a short teaser video for a new single on Instagram and TikTok. By opening Soundcharts, you see that on Instagram you have a small but steady increase in followers. Meanwhile, on TikTok the graph has shot up, and your profile has gained thousands of new followers in a few days. This is a clear signal that TikTok has become the key platform for promoting your new track. Based on these data, you can focus your efforts there.
Analyzing social media through Soundcharts is not about numbers for the sake of numbers. It’s about understanding your fans, their interests, and the effectiveness of your efforts.
Radio — on-air life
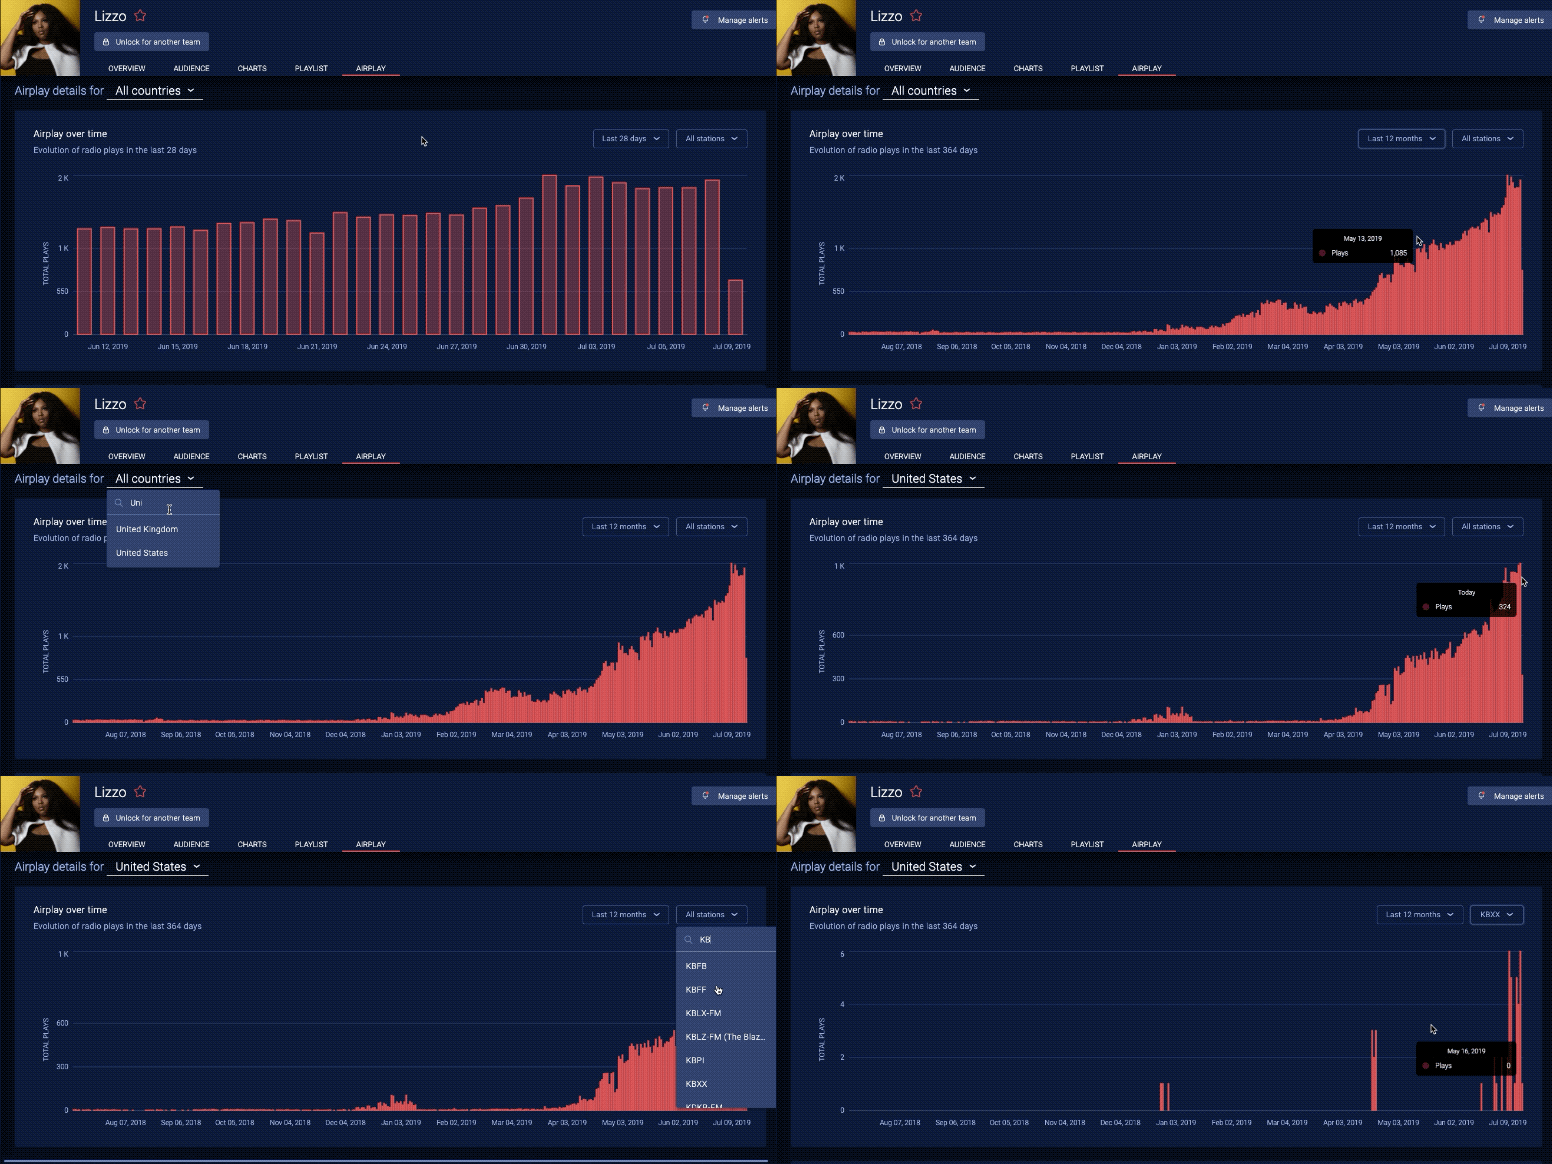
When your music gets on the radio, that’s a real victory. The Radio section in Soundcharts lets you monitor on-air exposure by tracking spins on radio stations around the world. This is not just good news — it’s important data for your PR plan and career growth.
Why is this useful?
Radio remains one of the key channels for discovering new music. Soundcharts lets you see where, when, and how many times your songs are played on air. You can monitor spins on both major commercial stations and smaller niche ones. This helps assess the effectiveness of radio promoters’ work or your own radio efforts.
What do we analyze?
Spin geography: See in which countries and cities your tracks are most frequently played on air. You may have received unexpected support in South America or Europe.
Frequency and time: Pay attention to how many times your songs are played on a particular station and at what time of day. This will help you understand whether your music is getting airplay in prime time.
Comparison with other artists: You can compare the number of your spins with those of other artists to understand your position in the radio market.
Practical case:
Imagine you’ve arranged a pitch with a radio station for a new single. A few weeks later you log into Soundcharts and see that the number of spins of your track on that station has risen sharply. This is a clear sign that the song has successfully made the cut and is being played heavily. It confirms your efforts and can serve as leverage in negotiations with other radio stations or labels.
Monitoring radio airplay is an important part of your music business, and Soundcharts makes it convenient and accessible.
How to set up Soundcharts — practical tips
You’ve already seen how powerful a tool Soundcharts can be. Now it’s time to take the first step and set up your profile to get the maximum benefit from the service. It’s very easy and will only take a few minutes.
Step-by-step guide:
Sign up: Go to the Soundcharts website and create your account. You can use your email or connect your Google account.
Add your profile: After registration, you’ll immediately see a dashboard where you can add an artist profile. Just enter your name or project name, and the system will find you in the database. Soundcharts aggregates data from millions of music profiles, so chances are your streaming and social pages are already there.
Verify your profile: If you want access to in-depth analytics and to manage metadata, you’ll need to verify that you are the artist’s representative. This is a standard procedure that protects the data from third parties.
Using it daily/weekly:
Daily: Check the Dashboard every morning to quickly review growth trends. This is your morning coffee ritual, and it will take no more than 5 minutes.
Weekly: Once a week, set aside 20–30 minutes for a deeper analysis. Review the Charts, Streaming, and Socials sections to see what changes have occurred. Assess how your PR campaigns are working and adjust your future plans.
Soundcharts is a tool for making strategic decisions. Use it not just to see the numbers, but to understand how they translate into real steps for growing your career.
Remember: the music business today is not only about talent, but also about informed decision-making. By understanding where your audience is, which of your tracks are most popular, and on which platforms you’re succeeding, you can build your career on facts rather than guesswork. Soundcharts makes this process as convenient and efficient as possible, allowing you to focus on what matters most — making music.
Take the first step toward a more comfortable music business today!
Author: Pavlo Striletskyi